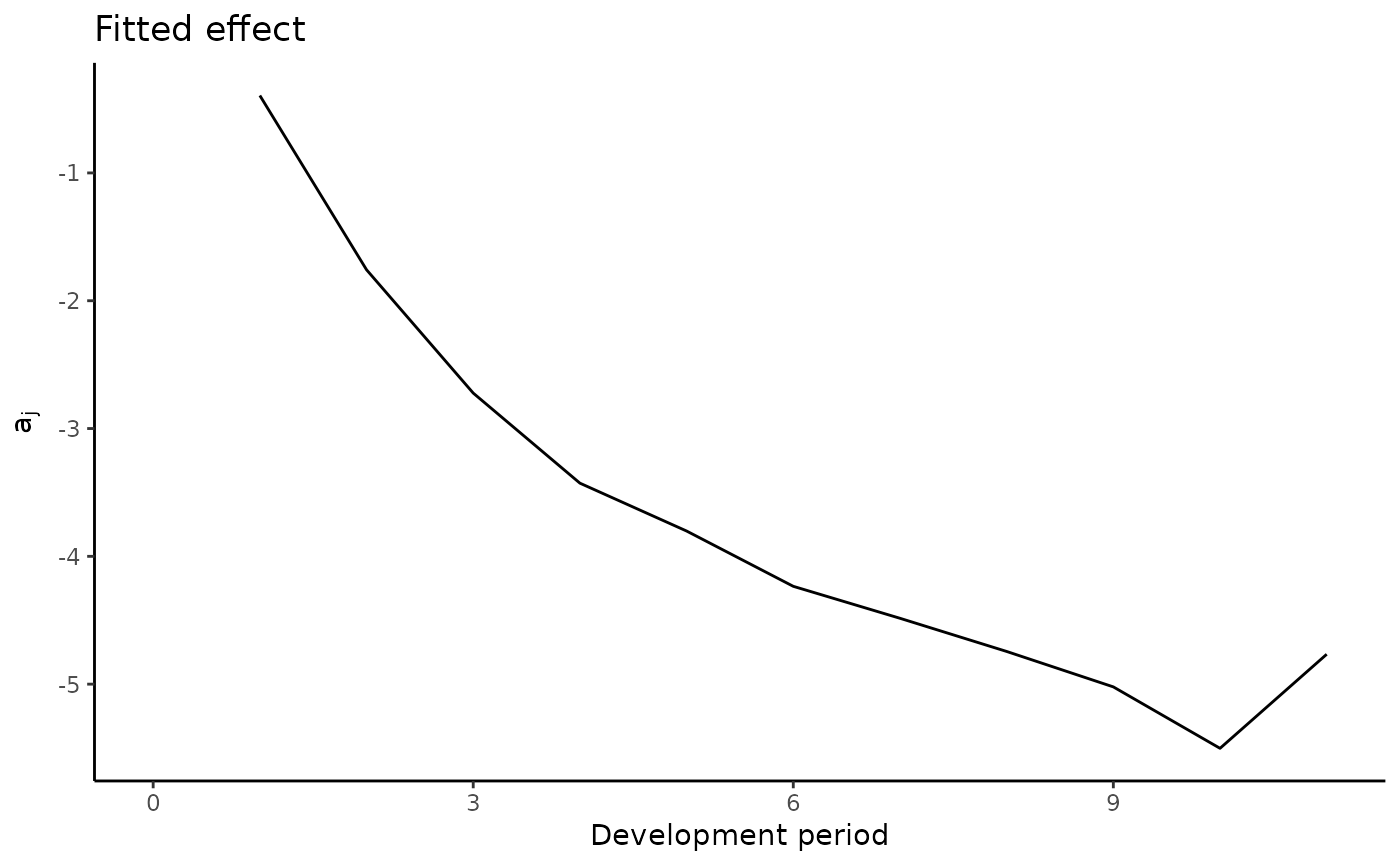
Plot the hazard model fitted and forecasted parameters
Source:R/plotclmpluspredictions.R
plot.clmpluspredictions.RdThis function allows to define the behavior of the triangle payments.
Usage
# S3 method for class 'clmpluspredictions'
plot(x, cy.type = "fe", ...)Value
A `gtable` containing one ggplot panel for each effect included in the fitted model. The table is returned visibly after being drawn.
References
Pittarello, G., Hiabu, M., & Villegas, A. M. (2023). Replicating and extending chain-ladder via an age-period-cohort structure on the claim development in a run-off triangle. arXiv preprint arXiv:2301.03858.
Examples
data(sifa.mtpl)
sifa.mtpl.rtt <- AggregateDataPP(cumulative.payments.triangle=sifa.mtpl)
clm.fit<-clmplus(sifa.mtpl.rtt, 'a')
#> Warning: StMoMo: 66 missing values which have been zero weighted
clm <- predict(clm.fit)
plot(clm)