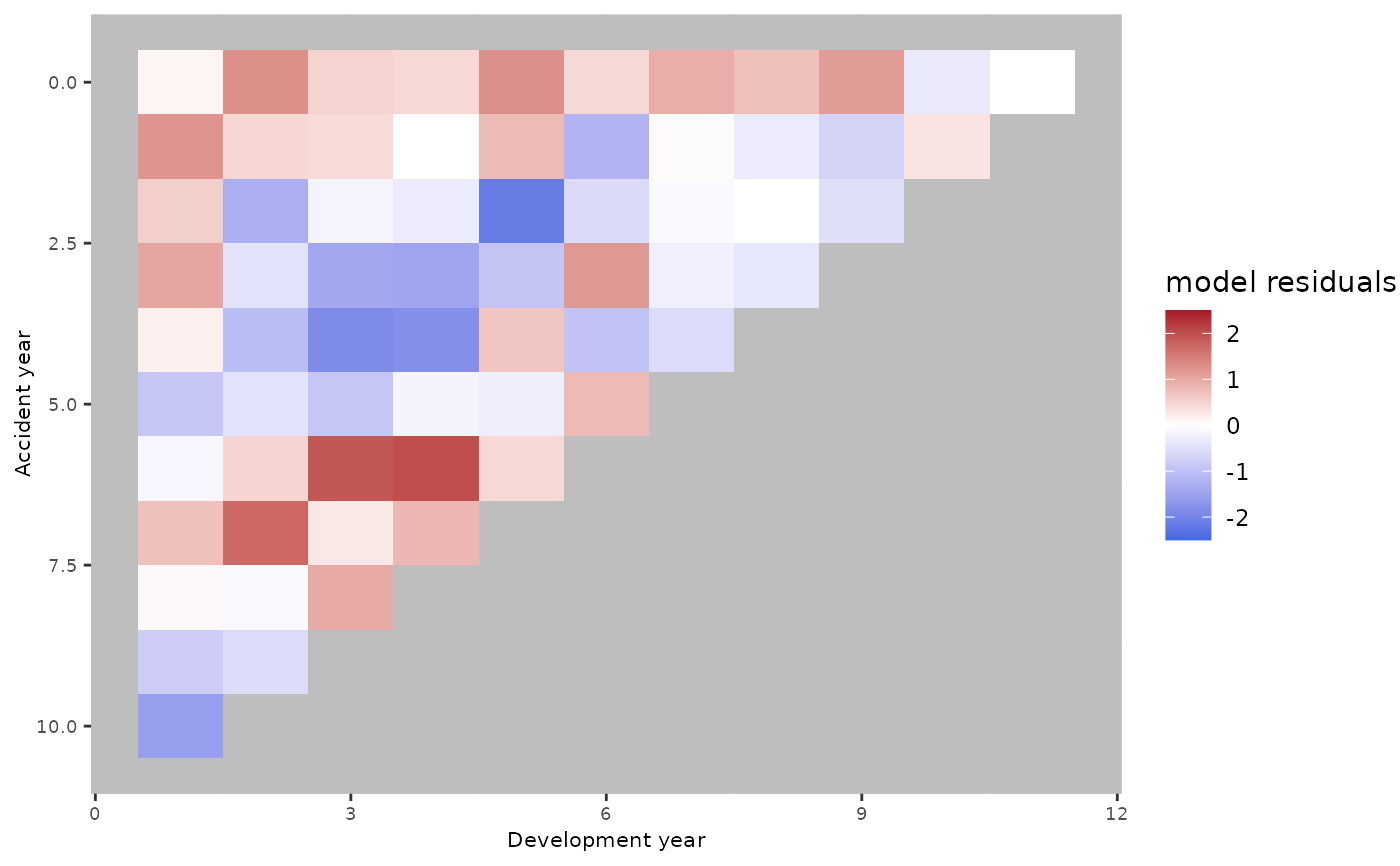
This function allows to plot the hazard model residuals on the triangle payments.
Value
A `ggplot` object showing scaled deviance residuals in accident-year by development-year triangle form.
References
Pittarello, Gabriele, Munir Hiabu, and Andrés M. Villegas. "Replicating and extending chain ladder via an age-period-cohort structure on the claim development in a run-off triangle." arXiv preprint arXiv:2301.03858 (2023).
Examples
data(sifa.mtpl)
sifa.mtpl.rtt <- AggregateDataPP(cumulative.payments.triangle=sifa.mtpl)
clm.fit<-clmplus(sifa.mtpl.rtt, 'a')
#> Warning: StMoMo: 66 missing values which have been zero weighted
plot(clm.fit)