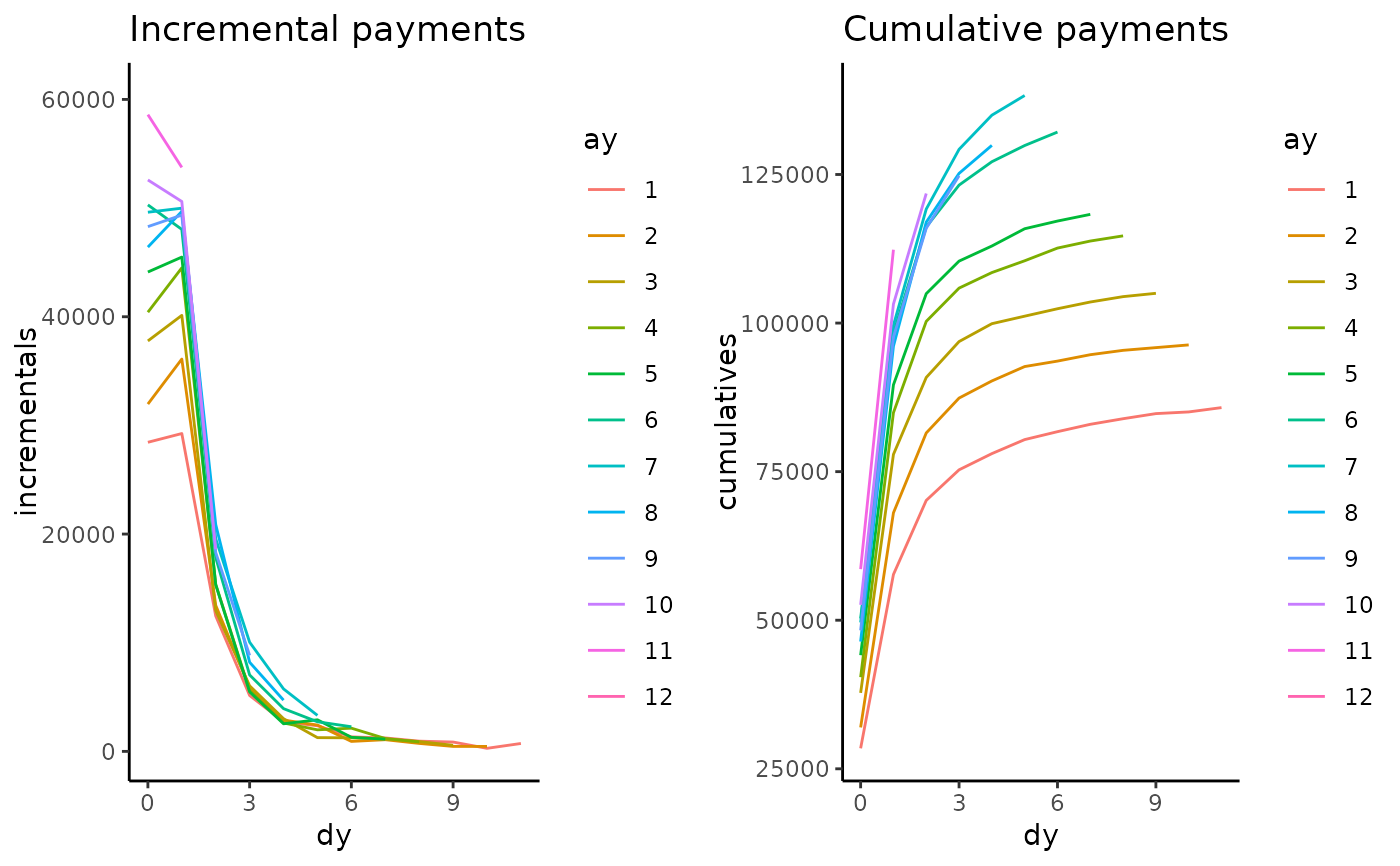
This function allows to define the behavior of the triangle payments.
Usage
# S3 method for class 'AggregateDataPP'
plot(x, ...)Value
A `gtable` containing two ggplot panels (incremental and cumulative paid amounts), returned visibly after being drawn.
References
Pittarello, Gabriele, Munir Hiabu, and Andrés M. Villegas. "Replicating and extending chain ladder via an age-period-cohort structure on the claim development in a run-off triangle." arXiv preprint arXiv:2301.03858 (2023).
Examples
data(sifa.mtpl)
sifa.mtpl.pp <- AggregateDataPP(cumulative.payments.triangle=sifa.mtpl)
plot(sifa.mtpl.pp)